Aircraft-Range.com is a unique platform that allows users to visualize aircraft range while incorporating real annual wind data. Unlike most tools that calculate range under “no wind” conditions, which often lead to misleading results, this tool provides realistic insights into how winds impact an aircraft’s operational range. It is an essential resource for anyone serious about evaluating aircraft for reaching specific destinations.
Understanding Wind Effects

Aircraft travel relative to the air, making wind a critical factor in their performance, especially at cruising altitudes where winds are significantly stronger.
- Headwinds (winds blowing against the aircraft's direction) reduce speed and range.
- Tailwinds (winds blowing with the aircraft's direction) increase speed and extend range.
Depending on the wind direction and strength, flight times can vary by up to an hour, resulting in differences of hundreds of miles in range.

Aircraft Range Wind Dataset
To produce realistic wind-adjusted range estimates, Aircraft-Range.com is built on a long-term global wind
climatology derived from more than four decades of meteorological reanalysis data compiled from multiple
scientific sources.
The processing pipeline ingests extremely large atmospheric datasets — exceeding hundreds of terabytes — and
transforms them into a structured statistical wind model suitable for directional flight performance analysis.
The atmosphere is discretized into a global three-dimensional grid composed of millions of spatial cells
(“geocubes”).
Each cell contains a statistical representation of prevailing wind conditions across altitude layers and
directional sectors, enabling consistent global coverage while preserving large-scale atmospheric patterns
relevant to aircraft operations.


Wind Statistics and Temporal Weighting
Wind statistics are produced through a proprietary multi-stage aggregation framework designed to balance climatological stability with operational relevance. The methodology incorporates temporal weighting techniques that emphasize recent atmospheric behavior while preserving long-term structural patterns necessary for robust global modeling. The resulting dataset captures persistent directional wind characteristics without attempting to forecast real-time weather. This approach ensures that calculated range envelopes reflect realistic long-term operating conditions rather than transient meteorological events.
How Wind Effects Are Calculated
Because exact weather conditions cannot be predicted for a specific flight far in advance, Aircraft-Range.com uses probabilistic wind scenarios derived from historical climatology. Range envelopes are computed by combining aircraft performance models with directional statistical wind fields to estimate realistic outbound and inbound reach under defined probability thresholds. The commonly used 85% probability level represents conservative operational wind conditions that are expected to be equaled or better during the majority of flights over long-term statistical averages. These probabilistic envelopes illustrate how wind asymmetry can significantly alter practical aircraft reach compared to traditional no-wind range figures.
Calculating Range with Wind: The Triangle of Velocities Problem
The wind’s effect on an aircraft’s flight path is addressed through the Triangle of Velocities. This principle illustrates how ground speed, the speed over the Earth’s surface, results from combining the aircraft’s airspeed with the wind velocity as vectors.
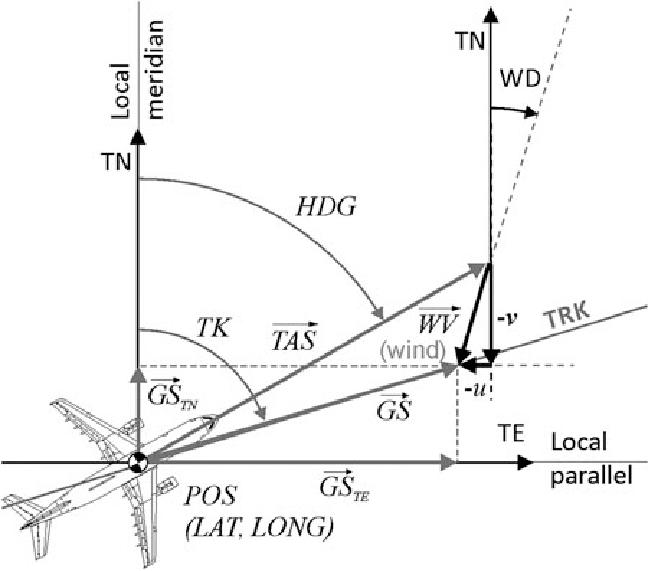
Key effects include:
- Headwinds reduce ground speed and range.
- Tailwinds increase ground speed and range.
- Crosswinds require heading adjustments and can indirectly affect range.
Over long flights, changing wind conditions add complexity to the calculation. Our model addresses this by simulating the flight through millions of atmospheric cells, each with localized wind vectors. By iteratively solving the Triangle of Velocities along the route, we ensure accurate modeling of cumulative wind effects on range. In predictive mode and in real-time ETA he graph plots distance on the x-axis and cumulative probability (0 to 1) on the y-axis. The line smoothly shows the increasing probability that the aircraft range will be less than or equal to that distance. Hovering over points will show exact probability values.
Cutoff: 1.04 σ — Cumulative Probability: 85%
Inbound and Outbound Flights
One insight offered by Aircraft-Range.com is the difference in inbound and outbound ranges due to wind effects. Certain destinations may be reachable in one direction but not the other way back. These differences are visualized through animations that highlight areas affected by one-way feasibility.
Aircraft Performance
To calculate range accurately, our model simulates three-dimensional flight paths, incorporating variations in
wind conditions at different altitudes. This requires aircraft-specific performance data, including climb and
descent profiles. We use data from open-source repositories like Eurocontrol

Visualization Features
- Wind Animation: High-altitude statistical winds are displayed as an animation to help users better understand their effects.
- Projection Options: Users can choose from several Earth projections to visualize ranges in their preferred format.
- Earth Customization: Customize country colors to suit specific needs or preferences.
Seasonality and Beyond
Range calculations assume an 85% probability threshold. However, users can explore alternate probability assumptions for more customized results. Seasonal variations also significantly impact wind conditions, meaning range calculations will differ depending on the time of year.
For further customization or advanced calculations, please contact us at info@aircraft-range.com.
About the author:

The founder of aircraft-range, Jean-Louis Cehovic holds a master's degree in aeronautical engineering from
ENAC – the French Civil Aviation Academy.
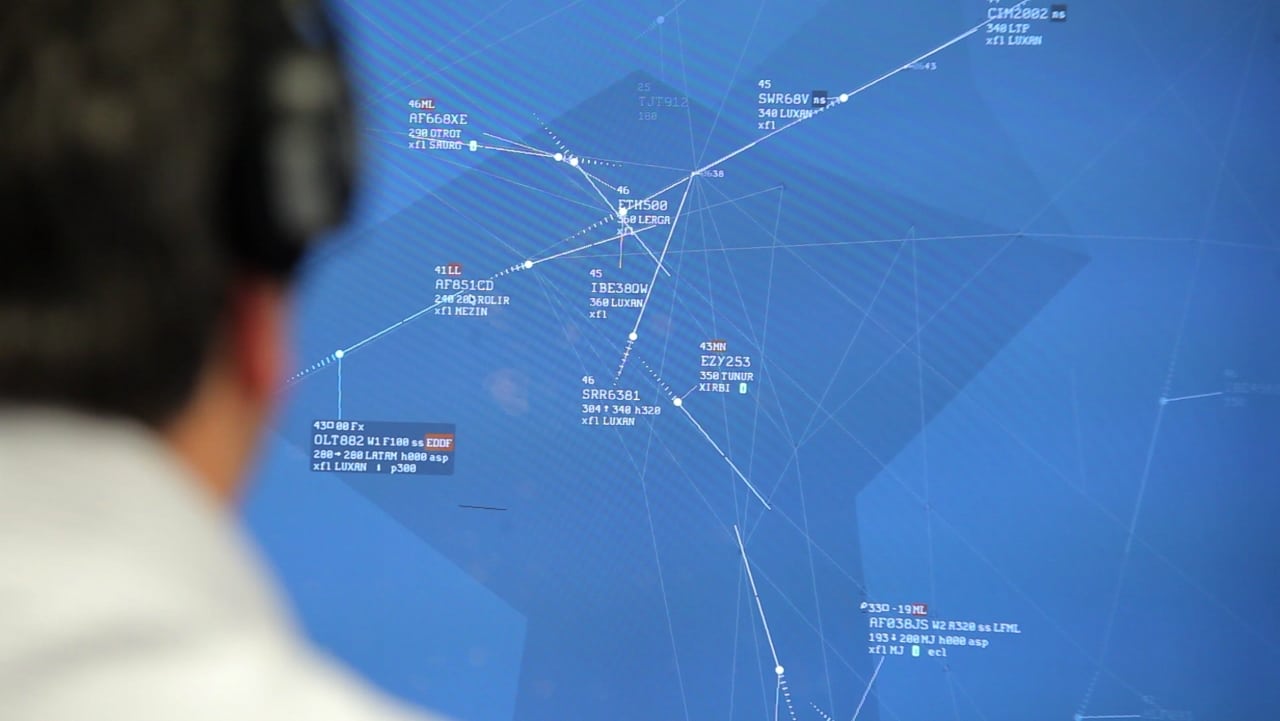
He spent nearly a decade at Thales, the company behind TopSky, the world's leading air traffic control
systems, used to manage over 80% of the global airspace.
Later in his career, Jean-Louis moved into executive and commercial roles within the business aviation sector, including leadership responsibilities at a business jet operator before transitioning into aircraft brokerage and performance analysis. Through extensive operational and commercial experience, he identified a persistent gap in the industry: while manufacturers publish nominal aircraft range figures, no independent analytical platform existed to visualize how long-term atmospheric conditions — particularly prevailing winds — affect real-world aircraft reach and directional capability. Recognizing that meaningful range analysis required more than traditional performance tables, he initiated the development of a global analytical framework combining aircraft performance modeling with large-scale historical wind climatology. The objective was not to forecast individual flights, but to create a statistically grounded representation of how aircraft range behaves under realistic long-term operating conditions. The resulting platform integrates decades of atmospheric data into a structured global wind model spanning all major flight levels. This analytical foundation enables the calculation of directional and probabilistic range envelopes, providing a more operationally meaningful representation of aircraft reach than conventional no-wind performance figures.
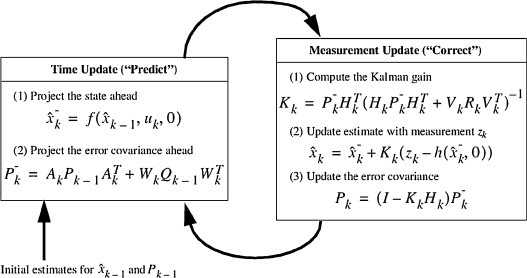
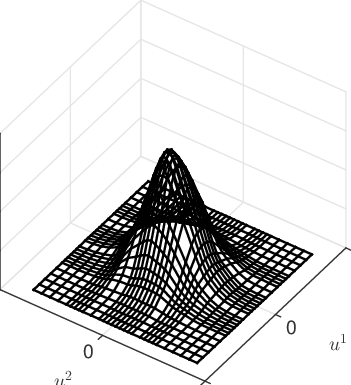
To condense the vast dataset into a usable format without sacrificing accuracy, Jean-Louis applied the
Bivariate Normal Distribution
Equipped with this advanced wind model and an optimized aircraft path estimator, through Aircraft-Range, Jean-Louis developed a state-of-the-art tool for calculating ranges of aircrafts with statistical winds. The flight path estimator was designed to perform millions of atmospheric cell computations within seconds, ensuring both precision and efficiency. The algorithm was further enhanced with multi-threaded parallel processing, leveraging multi-core processors to deliver results to users in mere milliseconds.
To complement the computational backend, Jean-Louis sought a user-friendly way to present the results.
Collaborating with the open-source community, he adopted modern technologies, including Java and
D3.js, for bespoke data visualization. One of the key features he implemented was the
Adaptive Resampling Algorithm of D3.js,
This project represents the culmination of collaborative innovation and continuous refinement, delivering a powerful, user-friendly tool for aviation professionals to accurately calculate and visualize aircraft range. By combining statistical wind models with advanced interactive visualization, it enables a deeper, real-world understanding of aircraft performance across varying flight conditions. From aircraft manufacturers and airlines to business jet operators, charter brokers, leasing companies, banks, and aviation consultants, this platform supports more confident, data-driven decision-making at every level of the industry. Explore the tool today and experience a smarter way to plan, compare, and evaluate aircraft range with precision and clarity.
Why Aircraft-Range.com Is the Best Tool for Mapping Aircraft Ranges
When it comes to mapping aircraft performance and reach, precision and clarity are non-negotiable. That’s exactly what Aircraft-Range.com delivers—making it the most advanced and user-focused tool for visualizing aircraft range maps available today.
Centered on What Matters: Your Airport
Unlike generic mapping tools, Aircraft-Range.com does something remarkably simple yet powerful: it automatically centers the map on the airport of interest.
That means whether you're planning routes from London, São Paulo, Dubai, or a remote island strip, the tool ensures that the airport is always the heart of your map—allowing for intuitive and accurate route assessment in all directions.
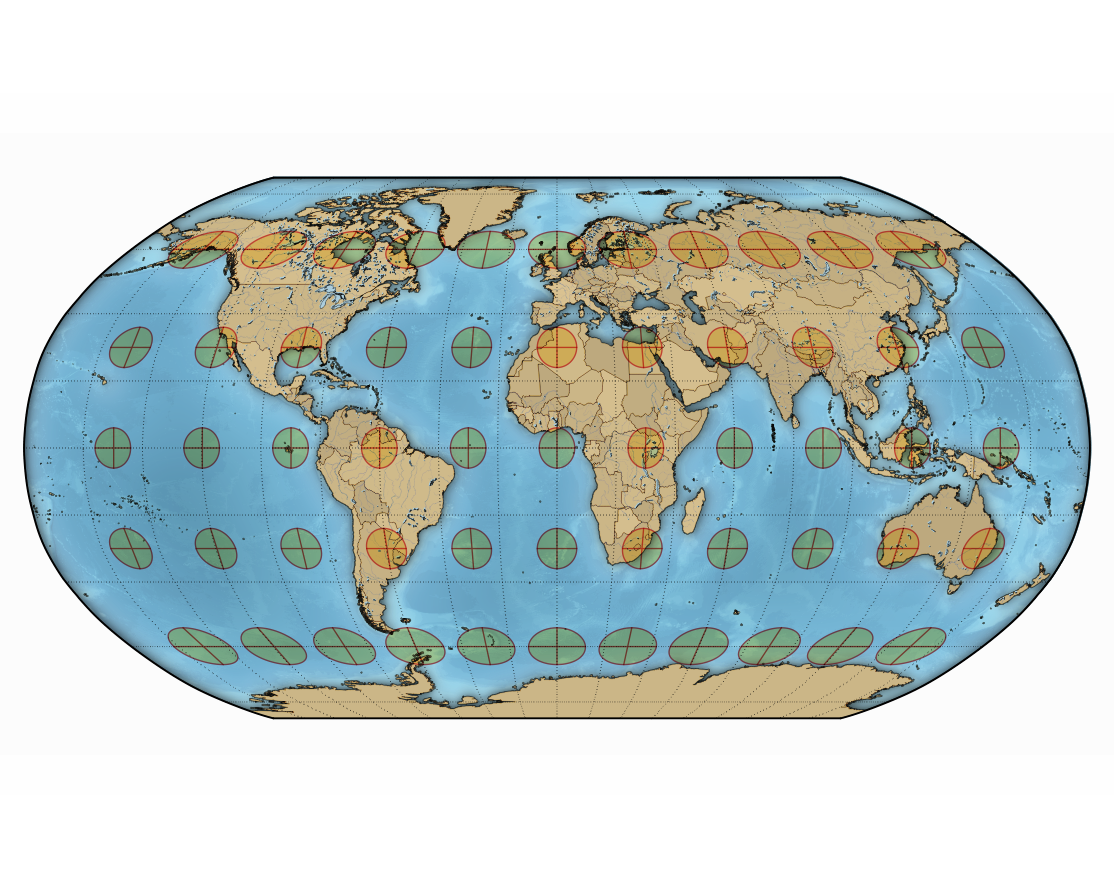
Projection-Aware Centering
Map projections affect how we perceive distance and area. Aircraft-Range.com handles this complexity for you by intelligently adapting centering based on the projection type:
- For horizontal-symmetric projections (like Mercator, Plate Carrée, or Patterson), the map centers horizontally on the airport—keeping east-west routes naturally balanced and intuitive.
- For central projections (such as Orthographic, Azimuthal Equidistant, or Gnomonic), the airport becomes the true geometric center of the globe’s curvature—perfect for showing great-circle routes, polar access, and hemispherical coverage.
This smart centering dramatically improves how range circles are interpreted and ensures that the aircraft’s operational footprint is shown as realistically as possible.
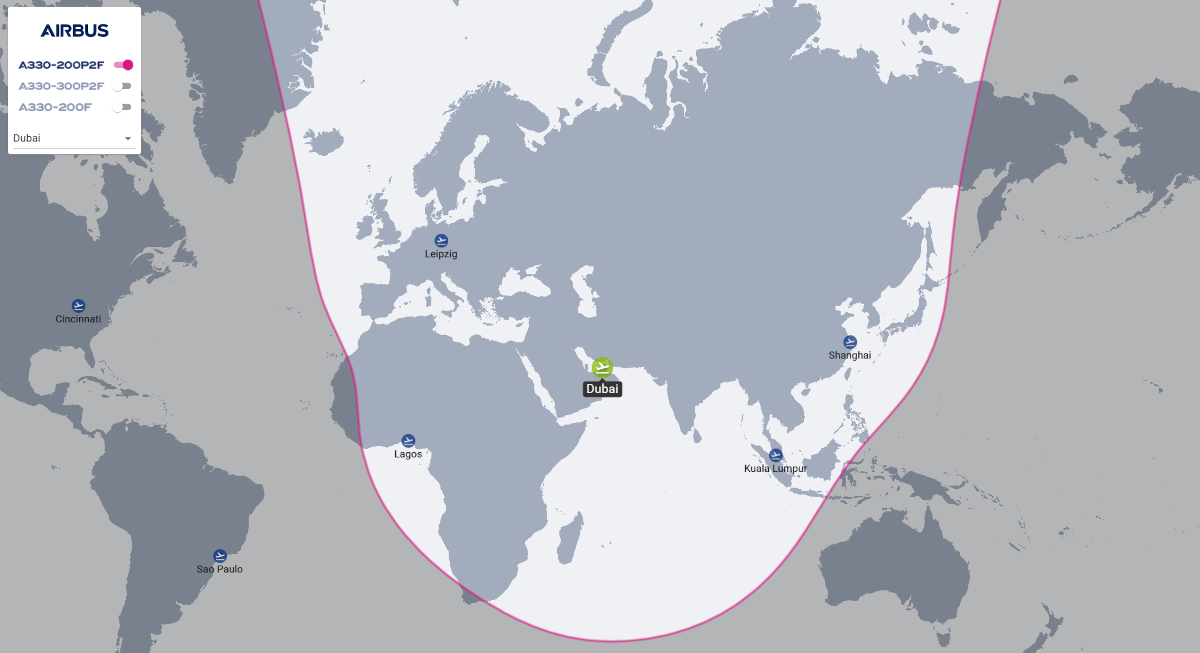
Airbus A330 range map
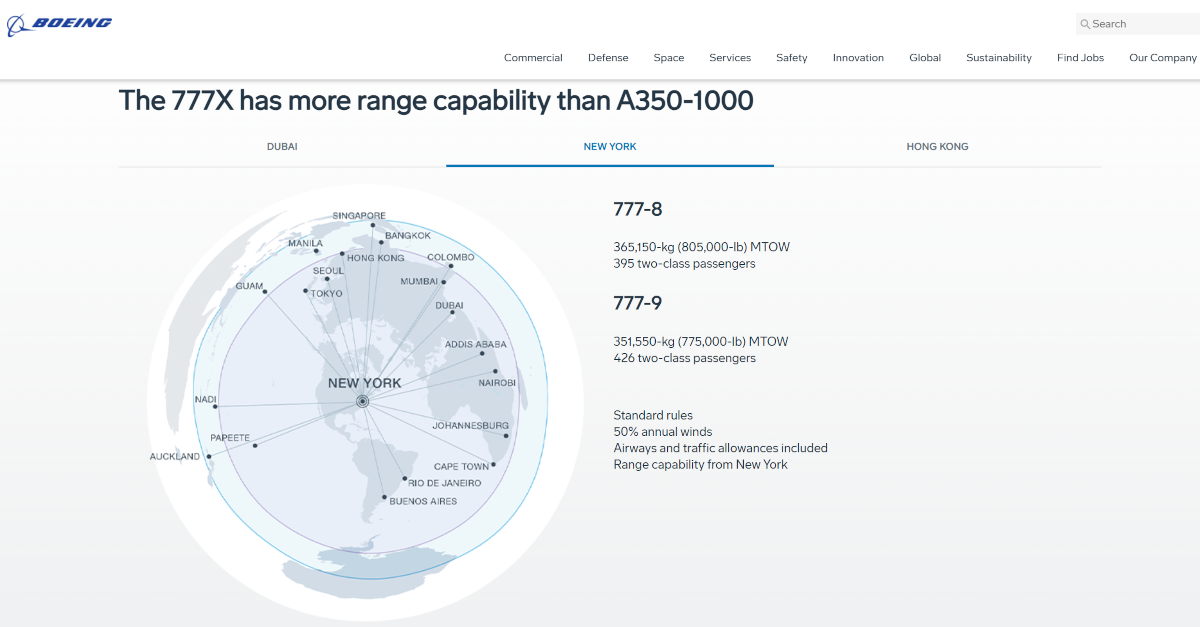
Boeing 777X range map
Not Just a Map—An Aircraft Tool
While many tools are simply general-purpose map viewers, Aircraft-Range.com is designed specifically for aircraft performance analysis. Features include:
- Support for various aircraft types and configurations
- Wind-adjusted performance estimates
- Range maps layered with great-circle boundaries and international airspace
- Custom fuel reserve logic and time-based distance calculations
Everything about the experience is built for aviation professionals, operators, buyers, analysts, and enthusiasts who need accuracy—not gimmicks.
Conclusion: See the World Through the Right Lens
Whether you're assessing a transatlantic mission, comparing aircraft types, or simply exploring the globe through the lens of aircraft capability, there’s only one tool that puts accuracy, geometry, and user-centric design first.
Visit Aircraft-Range.com to explore the richness of maps tailored specifically for aircraft range circles—and experience flight planning the way it was meant to be visualized.
⚠️ Important Considerations and Disclaimer
Not a Flight Planning Tool
Aircraft-Range.com is not intended for operational flight planning. It does not assess the feasibility of actual flights, including runway length, airport performance limitations, or terrain and obstacle clearance.
Use Official Charts and Tools
All planning and navigation decisions must be based on official aeronautical charts and certified flight planning systems . The outputs from this website are for illustrative and informational purposes only.
Minimum Fuel Reserves Not Included
Displayed ranges do not factor in fuel reserves, alternate requirements, or regulatory margins . Users are solely responsible for ensuring all legal and operational fuel planning standards are met.
ETOPS and Regulatory Requirements
The site does not validate compliance with ETOPS regulations or alternate airport availability. Operators must independently verify compliance with all applicable airworthiness and operational regulations, including ETOPS, ETPs, and driftdown scenarios.
No Warranties or Guarantees
Aircraft-Range.com is provided "as is" without warranty of any kind. No guarantees are made regarding accuracy, completeness, suitability, or fitness for any specific use . By using this site, you agree that the authors and maintainers bear no liability for decisions made based on its content .